Plotting
Quick Visualize
- mvlearn.plotting.quick_visualize(Xs, labels=None, figsize=(5, 5), title=None, cmap=None, show=True, context='notebook', ax_ticks=True, ax_labels=True, scatter_kwargs={}, fig_kwargs={})[source]
Computes common principal components using MVMDS for dimensionality reduction and plots the multi-view data on a single 2D plot for easy visualization. This can be thought of as the multi-view analog of using PCA to decompose data and plot on principal components.
See also
- Parameters
Xs (list of array-likes or numpy.ndarray) --
Xs length: n_views
Xs[i] shape: (n_samples, n_features_i)
The multi-view data to reduce to a single plot.
labels (boolean, default=None) -- Sets the labels of the samples.
figsize (tuple, default=(5,5)) -- Sets the figure size.
title (string, default=None) -- Sets the title of the figure.
cmap (String, default=None) -- Colormap argument for matplotlib.pyplot.scatter.
show (boolean, default=True) -- Shows the plots if true. Returns the objects otherwise.
context (one of {'paper', 'notebook', 'talk', 'poster, None},) -- default='notebook' Sets the seaborn plotting context.
ax_ticks (boolean, default=True) -- Whether to have tick marks on the axes.
ax_labels (boolean, default=True) -- Whether to label the axes with the view and dimension numbers.
scatter_kwargs (dict, default={}) -- Additional matplotlib.pyplot.scatter arguments.
fig_kwargs (dict, default={}) -- Additional matplotlib.pyplot.figure arguments.
- Returns
fig -- Only returned if show=False.
- Return type
figure object
Notes
This function simply uses
MVMDSwithn_components=2to reduce arbitrarily many views of input data to 2-dimensions, then makes a scatter plot.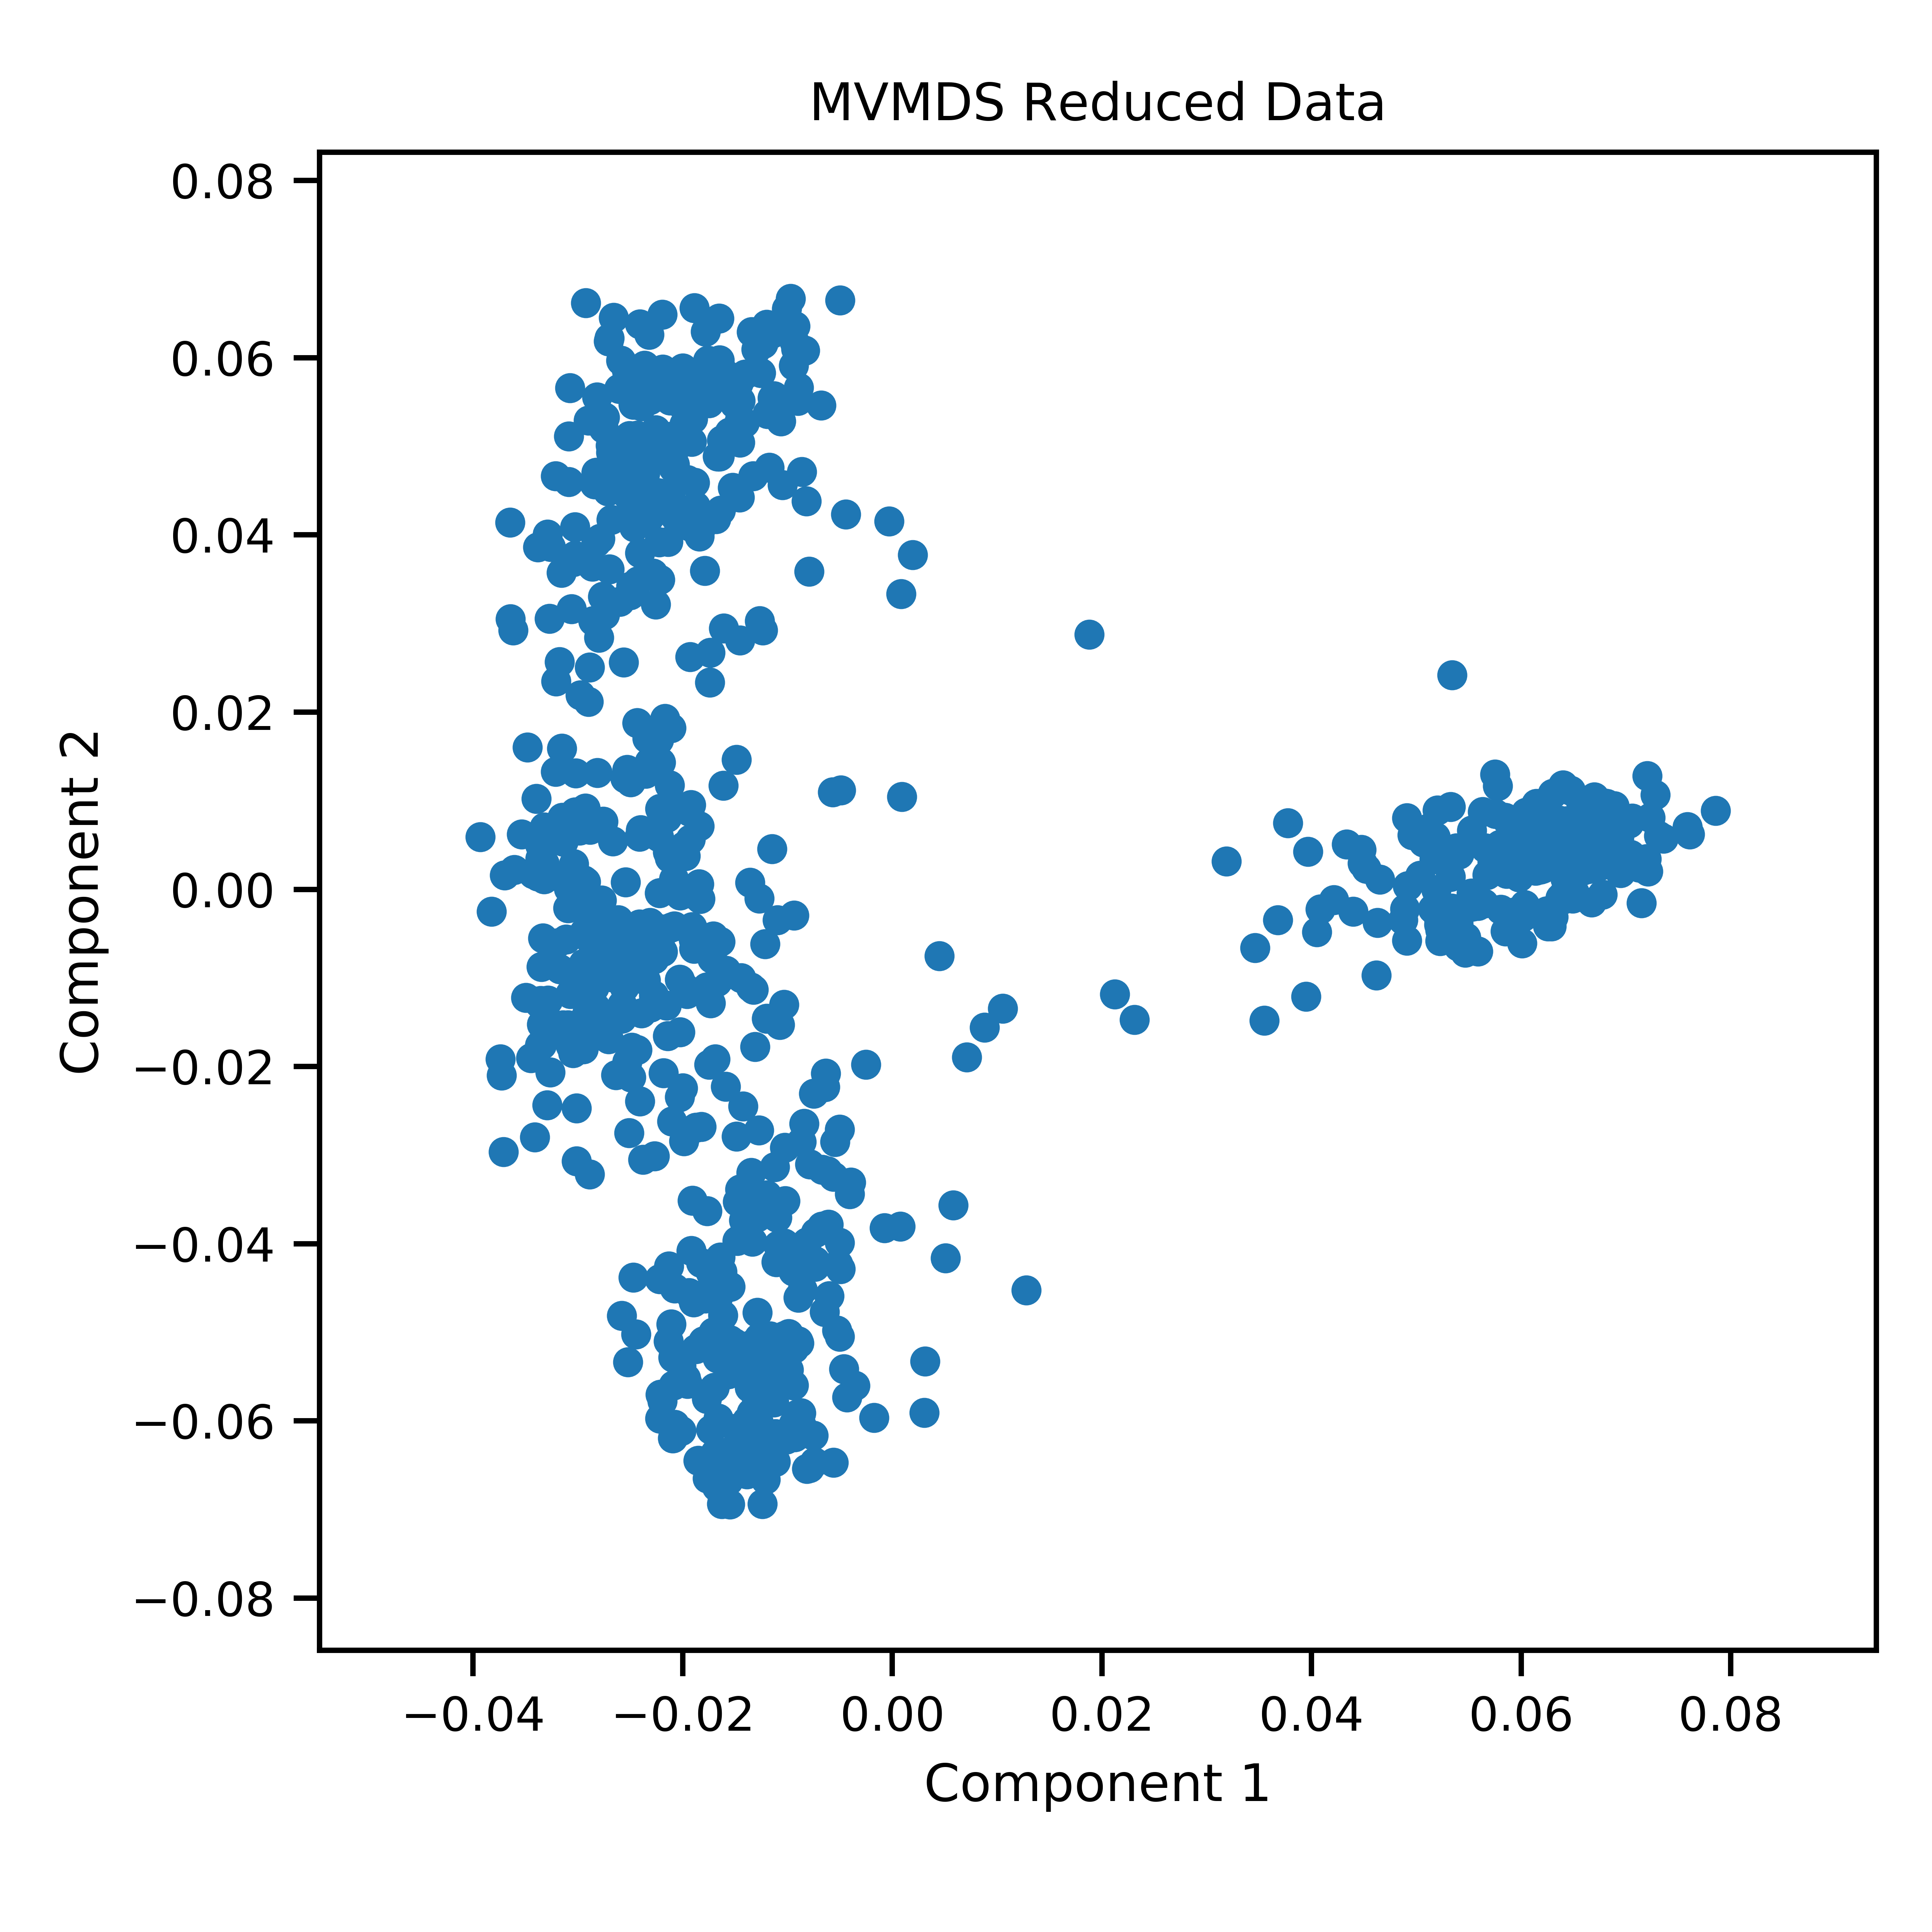
Crossviews Plot
- mvlearn.plotting.crossviews_plot(Xs, labels=None, dimensions=None, figsize=(10, 10), title=None, cmap=None, show=True, context='notebook', equal_axes=False, ax_ticks=True, ax_labels=True, scatter_kwargs={}, fig_kwargs={})[source]
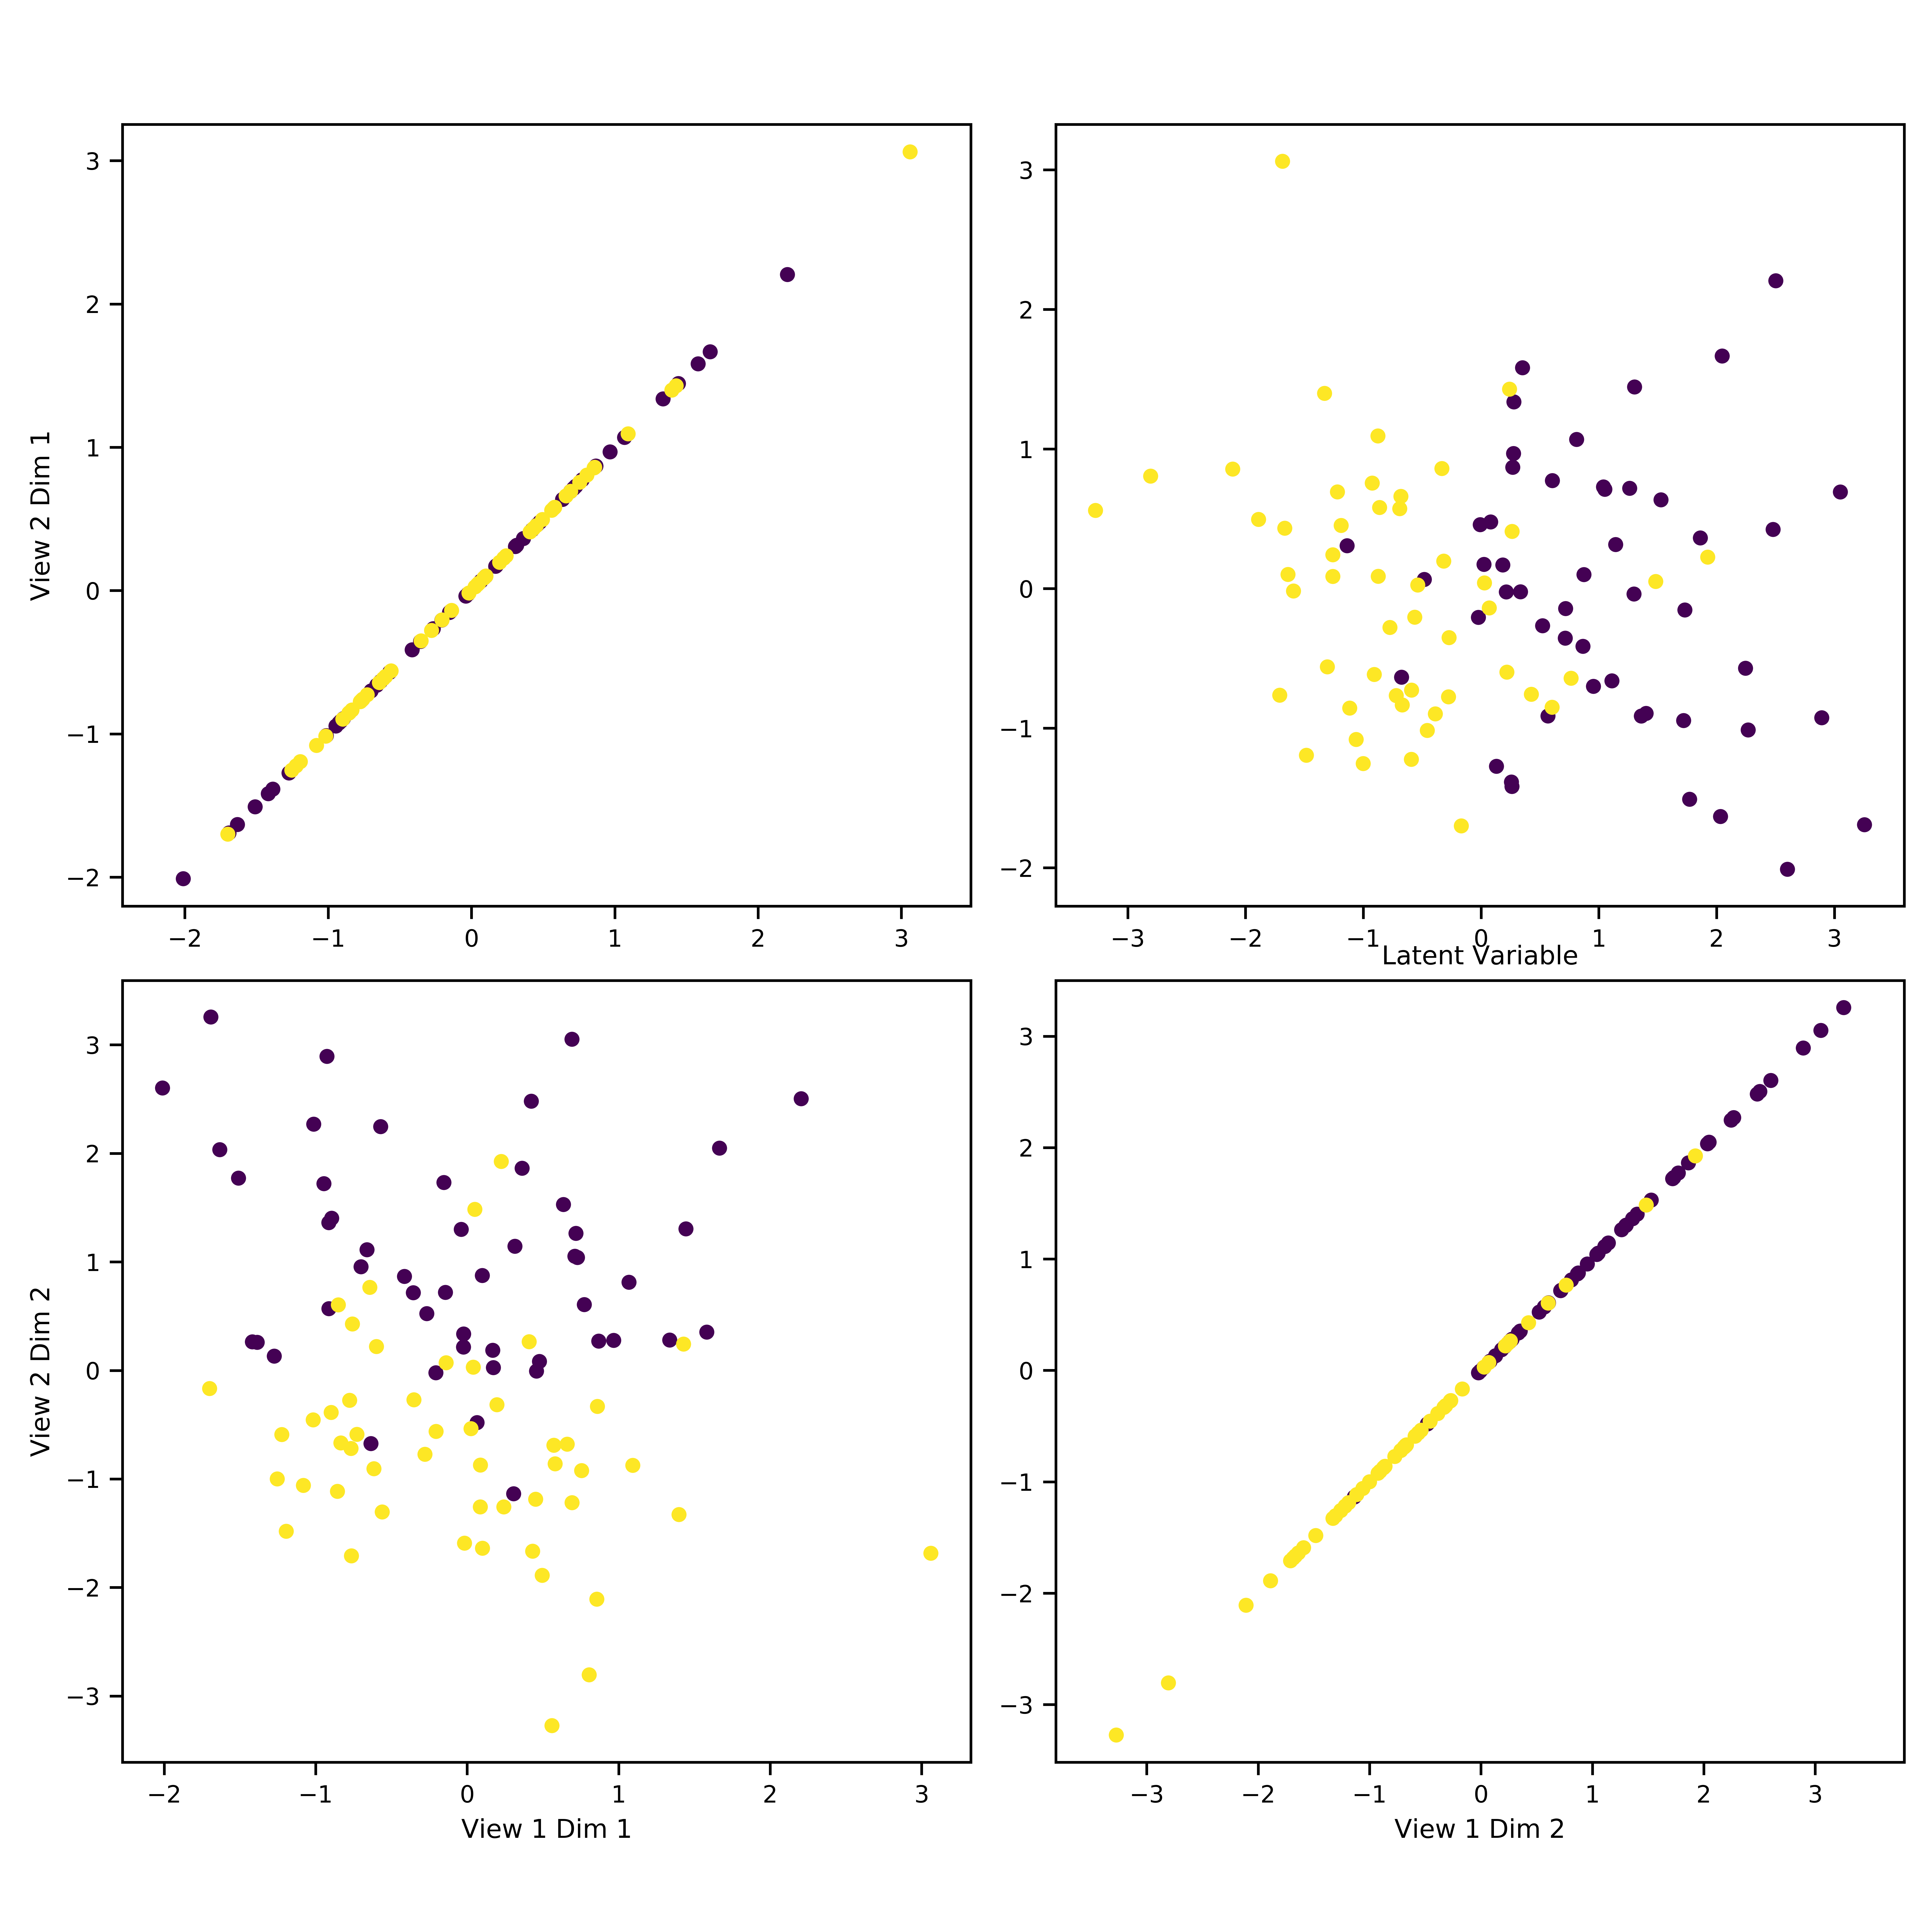
Plots each dimension fron one view against each dimension from a second view. If both views are the same, this reduces to a pairplot.
- Parameters
Xs (list of array-likes or numpy.ndarray) --
Xs length: n_views
Xs[i] shape: (n_samples, n_features_i)
The two views to plot against one another. If one view has fewer dimensions than the other, only that many will be plotted.
labels (boolean, default=None) -- Sets the labels of the samples.
dimensions (array-like of ints, default=None) -- The dimensions of the views to plot. If None, all dimensions up to the minimum between the views will be plotted.
figsize (tuple, default=(10,10)) -- Sets the grid figure size.
title (string, default=None) -- Sets the title of the grid.
cmap (String, default=None) -- Colormap argument for matplotlib.pyplot.scatter.
show (boolean, default=False) -- Shows the plots if true. Returns the objects otherwise.
context (one of {'paper', 'notebook', 'talk', 'poster, None},) -- default='notebook' Sets the seaborn plotting context.
equal_axes (boolean, default=False) -- Equalizes the axes of the plots on the diagonals if true.
ax_ticks (boolean, default=True) -- Whether to have tick marks on the axes.
ax_labels (boolean, default=True) -- Whether to label the axes with the view and dimension numbers.
scatter_kwargs (dict, default={}) -- Additional matplotlib.pyplot.scatter arguments.
fig_kwargs (dict, default={}) -- Additional matplotlib.pyplot.subplots arguments.
- Returns
(fig, axes) -- Only returned if show=False.
- Return type
tuple of the figure and its axes.
Notes
Below is an example figure generated from 2 views with 2 features each.