Note
Click here to download the full example code
Plotting Multiview Data with a Cross-view Plot
In many cases with multi-view data, especially after use of an embedding algorithm, one is interested in visualizing two views across dimensions. One use is assessing correlation between corresponding dimensions of views. Here, we use this function to display the relationship between two views simulated from transformations of multi-variant gaussians.
# License: MIT
from mvlearn.datasets import make_gaussian_mixture
from mvlearn.plotting import crossviews_plot
import numpy as np
n_samples = 100
centers = [[0, 1], [0, -1]]
covariances = [np.eye(2), np.eye(2)]
Xs, y = make_gaussian_mixture(
n_samples, centers, covariances, transform='poly', noise_dims=2)
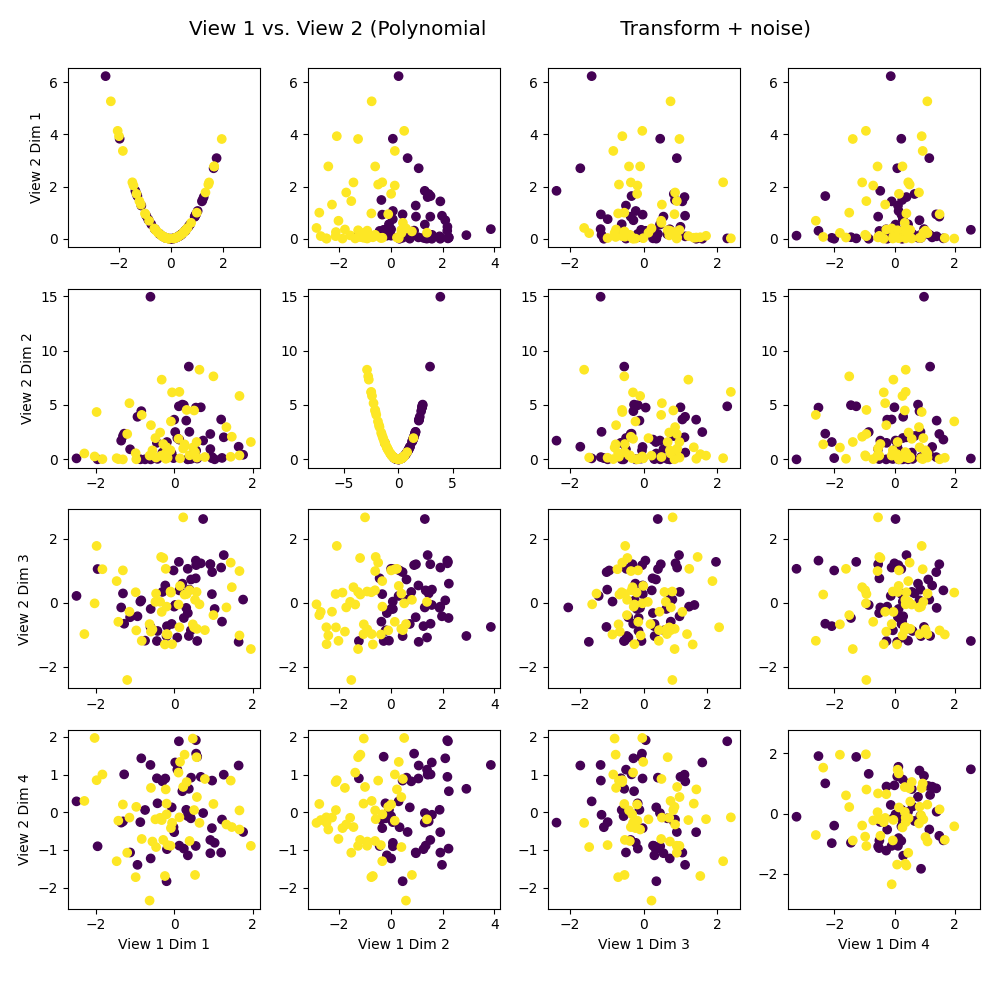
# Below, we see that the first two dimensions are related by a degree 2
# polynomial while the latter two dimensions are uncorrelated.
crossviews_plot(Xs, labels=y,
title='View 1 vs. View 2 (Polynomial \
Transform + noise)', equal_axes=True)
Total running time of the script: ( 0 minutes 0.816 seconds)