Note
Click here to download the full example code
Multiview vs. Singleview KMeans
This tutorial compares the multiview and singleview k-means algorithms on synthetic data to build intuition about what types of data distributions allow the multiview version of the algorithm to perform well.
# License: MIT

import warnings
import numpy as np
import matplotlib.pyplot as plt
from sklearn.cluster import KMeans
from sklearn.metrics import normalized_mutual_info_score as nmi_score
from mvlearn.cluster import MultiviewKMeans

warnings.filterwarnings("ignore")
RANDOM_SEED = 10
A function to generate 2 views of data for 2 classes
This function takes parameters for means, variances, and number of samples for class and generates data based on those parameters. The underlying probability distribution of the data is a multivariate gaussian distribution.
def create_data(seed, vmeans, vvars, num_per_class=500):

    np.random.seed(seed)
    data = [[], []]

    for view in range(2):
        for comp in range(len(vmeans[0])):
            cov = np.eye(2) * vvars[view][comp]
            comp_samples = np.random.multivariate_normal(vmeans[view][comp],
                                                         cov,
                                                         size=num_per_class)
            data[view].append(comp_samples)

    for view in range(2):
        data[view] = np.vstack(data[view])

    labels = list()
    for ind in range(len(vmeans[0])):
        labels.append(ind * np.ones(num_per_class,))

    labels = np.concatenate(labels)

    return data, labels
Creating a function to display data and the results of clustering
The following function plots both views of data given a dataset and corresponding labels.
def display_plots(pre_title, data, labels):

    # plot the views
    fig, ax = plt.subplots(1, 2, figsize=(14, 5))
    dot_size = 10
    ax[0].scatter(data[0][:, 0], data[0][:, 1], c=labels, s=dot_size)
    ax[0].set_title(pre_title + ' View 1')
    ax[0].axes.get_xaxis().set_visible(False)
    ax[0].axes.get_yaxis().set_visible(False)

    ax[1].scatter(data[1][:, 0], data[1][:, 1], c=labels, s=dot_size)
    ax[1].set_title(pre_title + ' View 2')
    ax[1].axes.get_xaxis().set_visible(False)
    ax[1].axes.get_yaxis().set_visible(False)

    plt.show()
Creating a function to perform both singleview and multiview kmeans clustering
def perform_clustering(seed, m_data, labels, n_clusters):
    # Singleview kmeans clustering
    # Cluster each view separately
    s_kmeans = KMeans(n_clusters=n_clusters, random_state=seed, n_init=100)
    s_clusters_v1 = s_kmeans.fit_predict(m_data[0])
    s_clusters_v2 = s_kmeans.fit_predict(m_data[1])

    # Concatenate the multiple views into a single view
    s_data = np.hstack(m_data)
    s_clusters = s_kmeans.fit_predict(s_data)

    # Compute nmi between true class labels and singleview cluster labels
    s_nmi_v1 = nmi_score(labels, s_clusters_v1)
    s_nmi_v2 = nmi_score(labels, s_clusters_v2)
    s_nmi = nmi_score(labels, s_clusters)
    print('Singleview View 1 NMI Score: {0:.3f}\n'.format(s_nmi_v1))
    print('Singleview View 2 NMI Score: {0:.3f}\n'.format(s_nmi_v2))
    print('Singleview Concatenated NMI Score: {0:.3f}\n'.format(s_nmi))

    # Multiview kmeans clustering

    # Use the MultiviewKMeans instance to cluster the data
    m_kmeans = MultiviewKMeans(n_clusters=n_clusters,
                               n_init=100, random_state=seed)
    m_clusters = m_kmeans.fit_predict(m_data)

    # Compute nmi between true class labels and multiview cluster labels
    m_nmi = nmi_score(labels, m_clusters)
    print('Multiview NMI Score: {0:.3f}\n'.format(m_nmi))

    return m_clusters
General experimentation procedures
For each of the experiments below, we run both singleview kmeans clustering and multiview kmeans clustering. For evaluating singleview performance, we run the algorithm on each view separately as well as all views concatenated together. We evalaute performance using normalized mutual information, which is a measure of cluster purity with respect to the true labels. For both algorithms, we use an n_init value of 100, which means that we run each algorithm across 100 random cluster initializations and select the best clustering results with respect to cluster inertia (within cluster sum-of- squared distances).
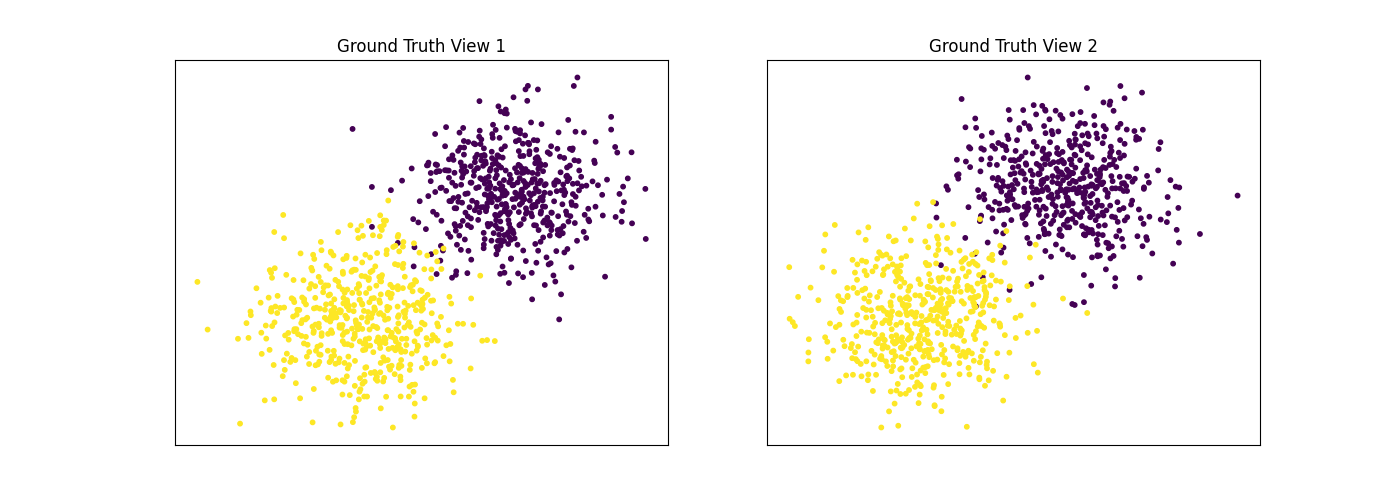
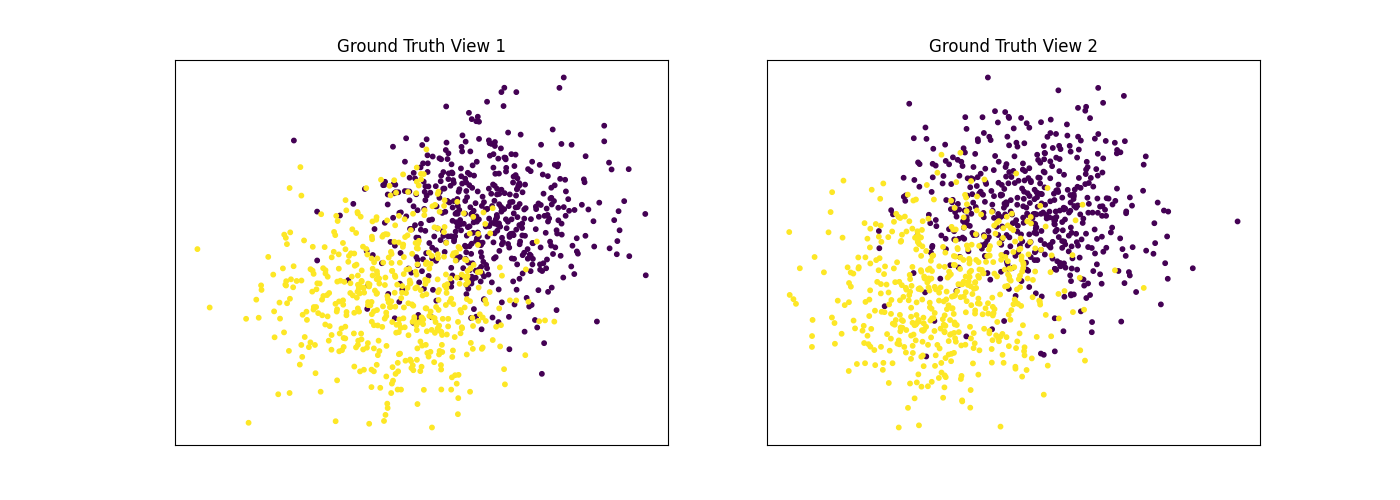
Performance when cluster components in both views are well separated
Cluster components 1: * Mean: [3, 3] (both views) * Covariance = I (both views)
Cluster components 2: * Mean = [0, 0] (both views) * Covariance = I (both views)
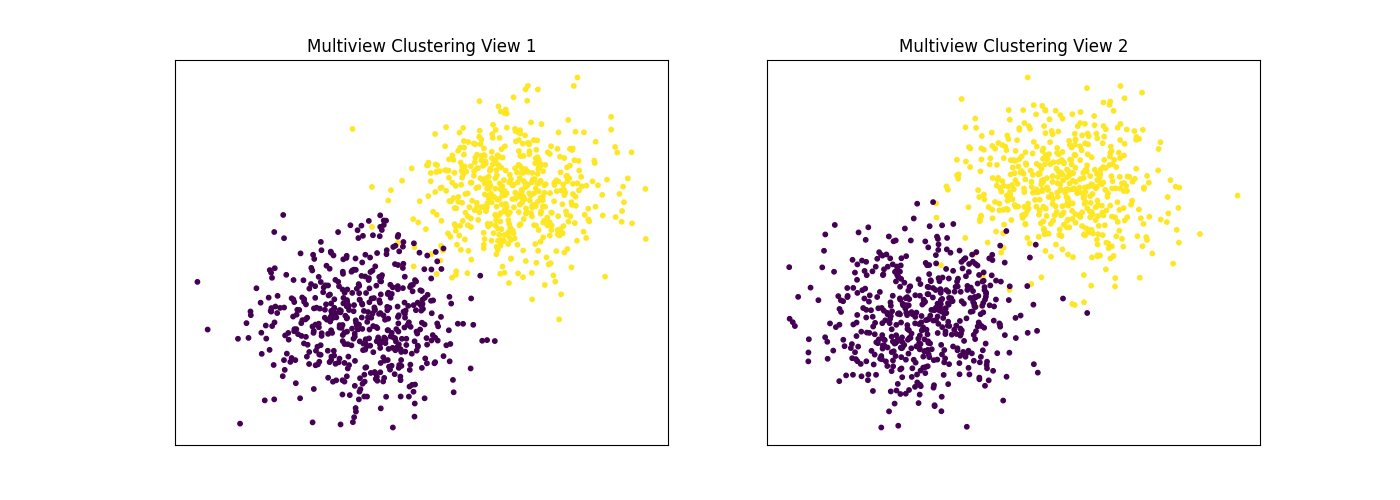
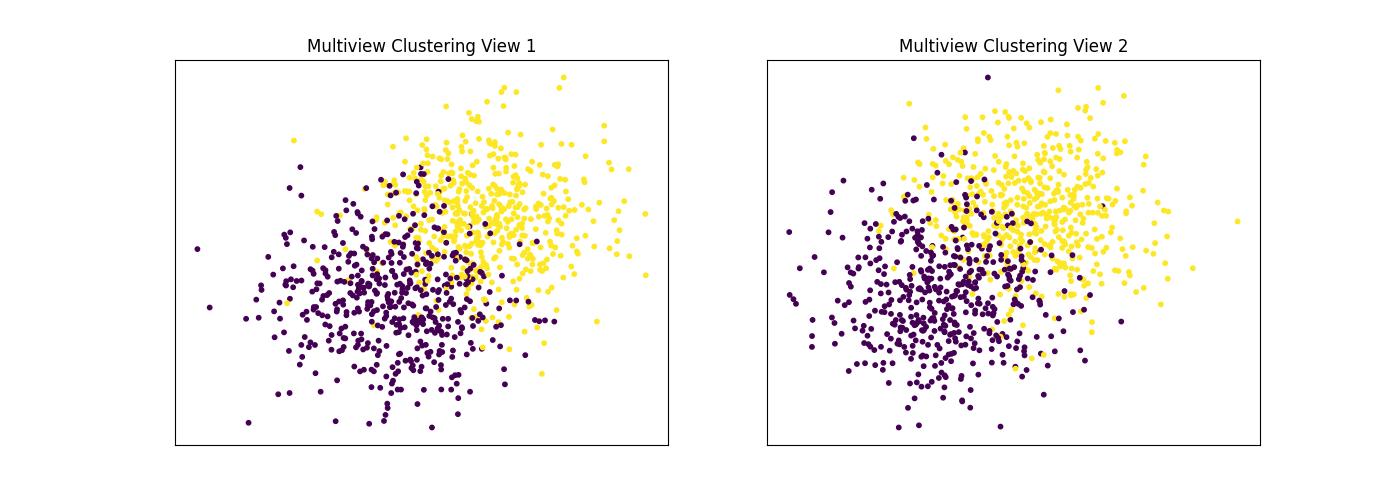
As we can see, multiview kmeans clustering performs about as well as singleview kmeans clustering for the concatenated views, and both of these perform better than on singleview clustering for just one view.
v1_means = [[3, 3], [0, 0]]
v2_means = [[3, 3], [0, 0]]
v1_vars = [1, 1]
v2_vars = [1, 1]
vmeans = [v1_means, v2_means]
vvars = [v1_vars, v2_vars]

data, labels = create_data(RANDOM_SEED, vmeans, vvars)
m_clusters = perform_clustering(RANDOM_SEED, data, labels, 2)
display_plots('Ground Truth', data, labels)
display_plots('Multiview Clustering', data, m_clusters)
Out:
Singleview View 1 NMI Score: 0.901

Singleview View 2 NMI Score: 0.888

Singleview Concatenated NMI Score: 0.990

Multiview NMI Score: 0.990
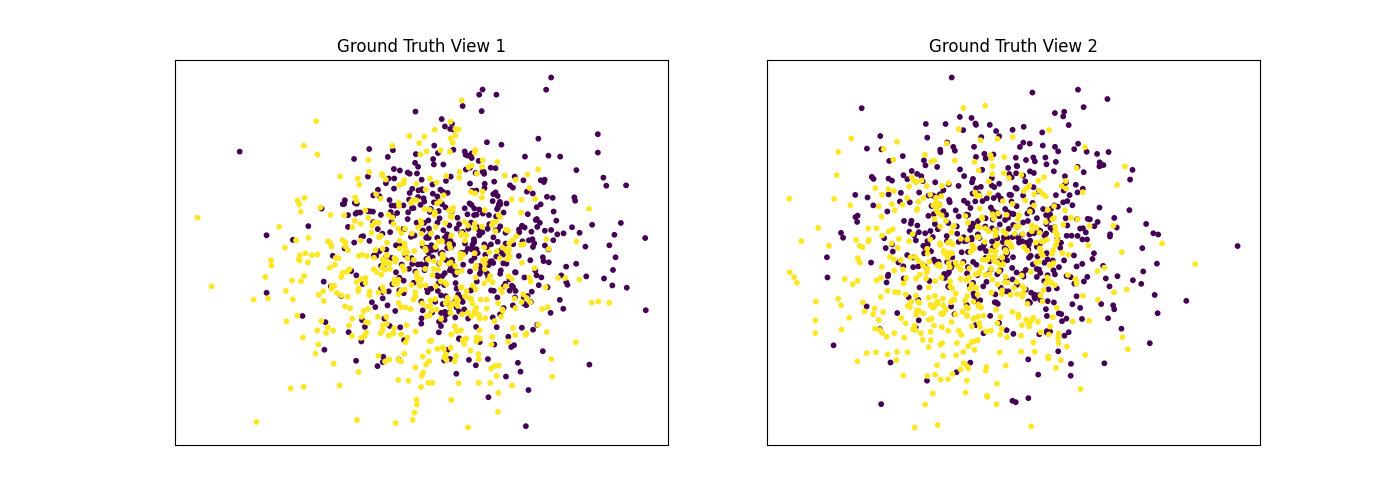
Performance when cluster components are relatively inseparable (highly overlapping) in both views
Cluster components 1: * Mean: [0.5, 0.5] (both views) * Covariance = I (both views)
Cluster components 2: * Mean = [0, 0] (both views) * Covariance = I (both views)
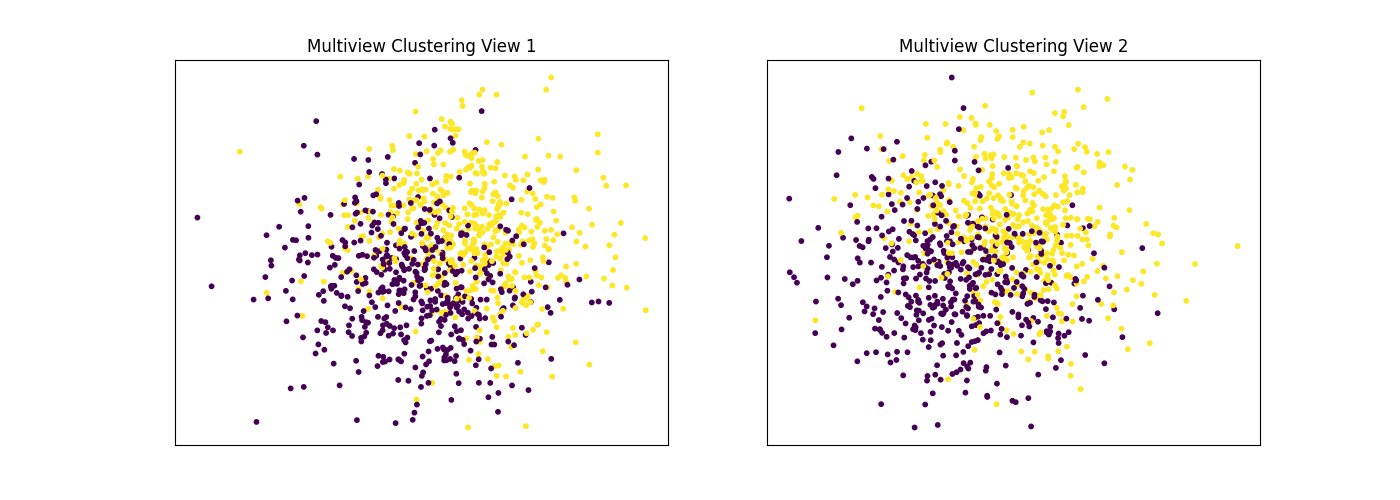
As we can see, multiview kmeans clustering performs about as poorly as singleview kmeans clustering across both individual views and concatenated views as inputs.
v1_means = [[0.5, 0.5], [0, 0]]
v2_means = [[0.5, 0.5], [0, 0]]
v1_vars = [1, 1]
v2_vars = [1, 1]
vmeans = [v1_means, v2_means]
vvars = [v1_vars, v2_vars]

data, labels = create_data(RANDOM_SEED, vmeans, vvars)
m_clusters = perform_clustering(RANDOM_SEED, data, labels, 2)
display_plots('Ground Truth', data, labels)
display_plots('Multiview Clustering', data, m_clusters)
Out:
Singleview View 1 NMI Score: 0.062

Singleview View 2 NMI Score: 0.044

Singleview Concatenated NMI Score: 0.098

Multiview NMI Score: 0.109
Performance when cluster components are somewhat separable (somewhat overlapping) in both views
Cluster components 1: * Mean: [1.5, 1.5] (both views) * Covariance = I (both views)
Cluster components 2: * Mean = [0, 0] (both views) * Covariance = I (both views)
Again we can see that multiview kmeans clustering performs about as well as singleview kmeans clustering for the concatenated views, and both of these perform better than on singleview clustering for just one view.
v1_means = [[1.5, 1.5], [0, 0]]
v2_means = [[1.5, 1.5], [0, 0]]
v1_vars = [1, 1]
v2_vars = [1, 1]
vmeans = [v1_means, v2_means]
vvars = [v1_vars, v2_vars]

data, labels = create_data(RANDOM_SEED, vmeans, vvars)
m_clusters = perform_clustering(RANDOM_SEED, data, labels, 2)
display_plots('Ground Truth', data, labels)
display_plots('Multiview Clustering', data, m_clusters)
Out:
Singleview View 1 NMI Score: 0.425

Singleview View 2 NMI Score: 0.410

Singleview Concatenated NMI Score: 0.657

Multiview NMI Score: 0.632
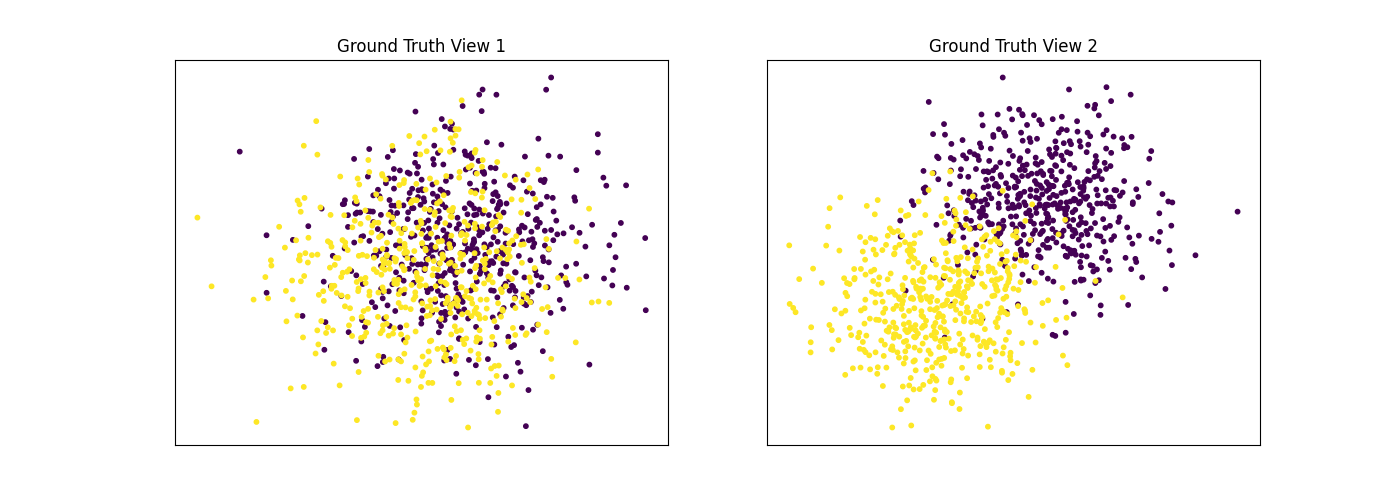
Performance when cluster components are highly overlapping in one view
Cluster components 1: * Mean: View 1 = [0.5, 0.5], View 2 = [2, 2] * Covariance = I (both views)
Cluster components 2: * Mean = [0, 0] (both views) * Covariance = I (both views)
As we can see, multiview kmeans clustering performs worse than singleview kmeans clustering with concatenated views as inputs and with the best view as the input.
v1_means = [[0.5, 0.5], [0, 0]]
v2_means = [[2, 2], [0, 0]]
v1_vars = [1, 1]
v2_vars = [1, 1]
vmeans = [v1_means, v2_means]
vvars = [v1_vars, v2_vars]

data, labels = create_data(RANDOM_SEED, vmeans, vvars)
m_clusters = perform_clustering(RANDOM_SEED, data, labels, 2)
display_plots('Ground Truth', data, labels)
display_plots('Multiview Clustering', data, m_clusters)

Out:
Singleview View 1 NMI Score: 0.062

Singleview View 2 NMI Score: 0.608

Singleview Concatenated NMI Score: 0.616

Multiview NMI Score: 0.591
Conclusions
Here, we have seen some of the limitations of multiview kmeans clustering. From the experiments above, it is apparent that multiview kmeans clustering performs equally as well or worse than singleview kmeans clustering on concatenated data when views are informative but the data is fairly simple (i.e. only has 2 features per view). However, it is clear that the multiview kmeans algorithm does perform better on well separated cluster components than it does on highly overlapping cluster components, which does validate it's basic functionality as a clustering algorithm.
Total running time of the script: ( 0 minutes 13.476 seconds)