Note
Click here to download the full example code
Generating Multiview Data from Gaussian Mixtures
In this example we show how to simulate multiview data from Gaussian mixtures and plot the views against each other using a crossviews plot.
# License: MIT
import numpy as np
from mvlearn.datasets import make_gaussian_mixture
from mvlearn.plotting import crossviews_plot
# Latent variables are sampled from two multivariate Gaussians with equal
# prior probability. Then a polynomial transformation is applied and noise
# is added independently to both the transformed and untransformed latents.
n_samples = 100
centers = [[0, 1], [0, -1]]
covariances = [np.eye(2), np.eye(2)]
Xs, y, latent = make_gaussian_mixture(
n_samples, centers, covariances, random_state=42, noise_dims=2,
shuffle=True, shuffle_random_state=42, transform='poly',
return_latents=True)
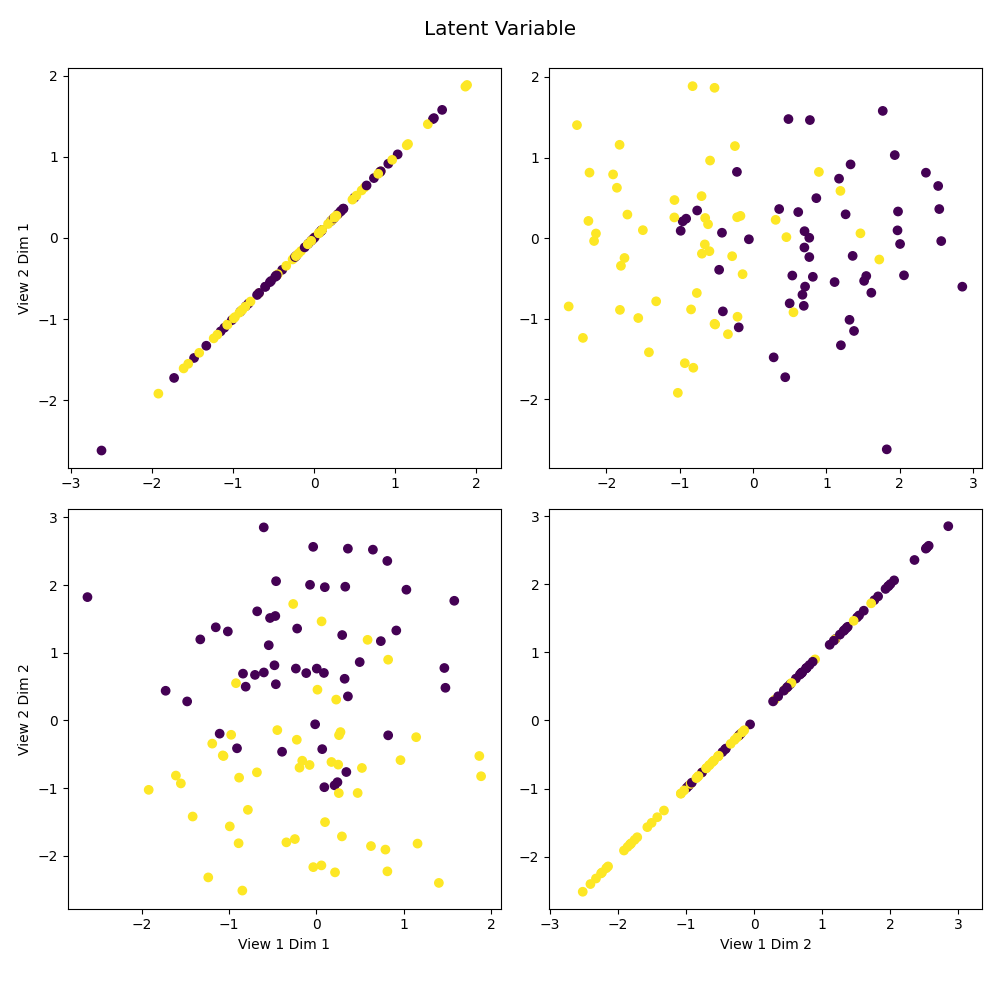
# The latent data is plotted against itself to reveal the underlying
# distribtution.
crossviews_plot([latent, latent], labels=y, title='Latent Variable',
equal_axes=True)
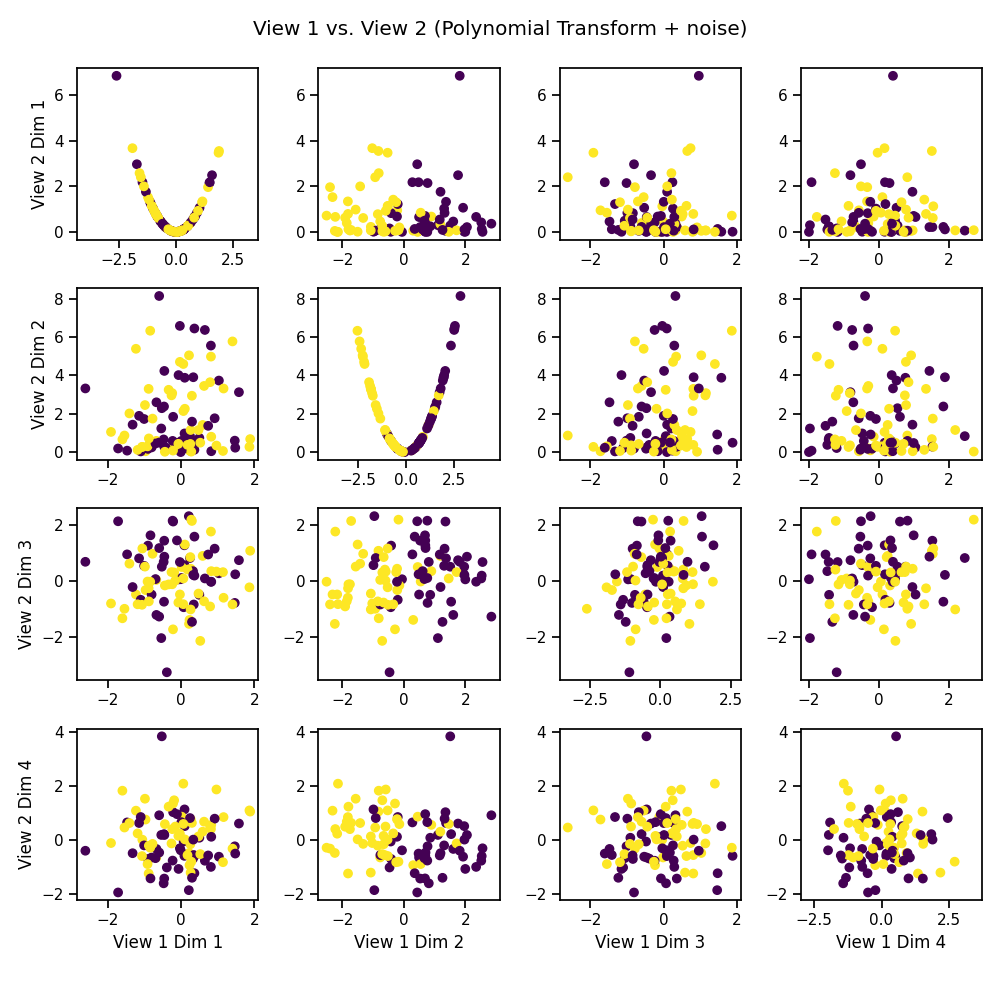
# The noisy latent variable (view 1) is plotted against the transformed latent
# variable (view 2), an example of a dataset with two views.
crossviews_plot(Xs, labels=y,
title='View 1 vs. View 2 (Polynomial Transform + noise)',
equal_axes=True)
Total running time of the script: ( 0 minutes 1.069 seconds)