Note
Click here to download the full example code
Quickly Visualizing Multiview Data
Often, before beginning extensive analysis, it is a good idea to visualize your dataset to help you understand its distribution and design algorithms. As a simple example, say we had high-dimensional multi-view data that we wanted to quickly visualize before we begin our analysis. With the quick_visualize function, we can easily do this. As an example, we will visualize the UCI Multiple Features dataset, which consists of 6 views of varying dimensionality.
# License: MIT

from mvlearn.plotting import quick_visualize
from mvlearn.datasets import load_UCImultifeature
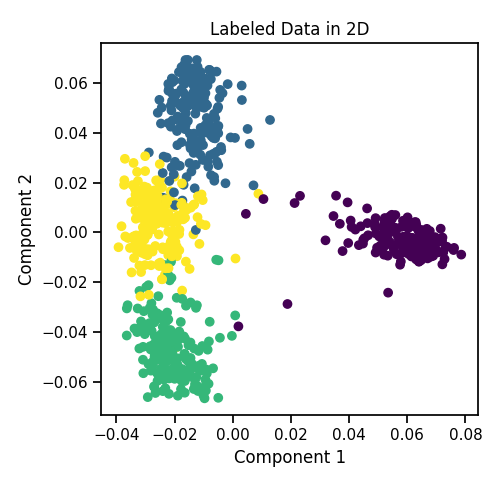
Visualize the Multiview Data
While a 2D plot will never fully capture the essence of a 6-view dataset, this simple visualization helps us build intuition about the dataset by showing us that it can be projected to a nearly-separable subspace.
# Load 4-class data
Xs, y = load_UCImultifeature(select_labeled=[0, 1, 2, 3])

# Visualize the data in 2D, coloring the points by their class label (0-3)
quick_visualize(Xs, labels=y, title='Labeled Data in 2D', figsize=(5, 5))
Total running time of the script: ( 0 minutes 1.608 seconds)